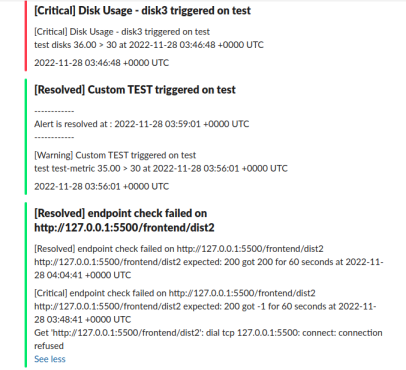
SyMon v2.0 with HTTP/S endpoint monitoring, server ping alerts, and custom metrics alerts
SyMon is a Linux system monitoring tool written in Go. I recently added few more features and made some changes on how it handles configurations for the version 2.0 release.
GitHub: https://github.com/dhamith93/SyMon
Download: https://github.com/dhamith93/SyMon/releases
Changelog⌗
Network Rx/Tx packet count for each network interface⌗
Improved network interface monitoring by collecting Upload/Download packet count data.
Switch to env variables for setting configurations for each component⌗
In the initial versions, the configurations were handled in all components of SyMon (agent, collector, alertprocessor, and client) by a config.json file. With version 2.0, the configurations are switched to env variables, with exceptions for list of services in agent component and the list of alerts in the collector component. All available configurations can be referred to in the .env-example file bundled with each component.
HTTP/S endpoint monitoring and alerting⌗
In version 2.0, the collector component, and the alertprocessor can be used together to monitor HTTP(S) GET and POST endpoints and generate alerts when the expected HTTP code does not match the actual response. Users can be alerted through Email, PagerDuty, or Slack, based on the configurations.
For example, to set up a GET endpoint monitor:
First enabled endpoint monitoring in the collector by setting env-var SYMON_ENABLE_ENDPOINT_MONITORING=true and SYMON_ENDPOINT_CHECK_INTERVAL=120 or the required interval between checks in seconds.
Then a new alert can be added to the alert config JSON file like the below. Once the collector service is restarted, it will monitor and alert based on the given config.
{
    "Name": "Endpoint check for HTTP code",
    "MetricName": "endpoint",
    "Endpoint": "https://someplace.com:6660",
    "TriggerIntveral": 60,
    "ExpectedHTTPCode": 200,
    "Method": "GET",
    "Template": "{subject}\n{endpoint} expected: {expected} got {actual} for {triggerInterval} seconds at {timestamp}\n{desc}",
    "Email": false,
    "PagerDuty": true,
    "Slack": true,
    "SlackChannel": ""
}
For POST endpoints, there are a couple more configurations that have to be set.
"Method": "POST",
"POSTContentType": "application/json",
"POSTBody": "{}",
Custom metrics alerting⌗
Similarly to the endpoint monitoring alerts, custom metrics alerting capability was also added to the client component with the version 2.0 release. To use custom metrics alerts, adding a new alert to the alert config JSON file and restarting the collector component is sufficient.
For example, a custom metrics collection can be done like the below scenario. The command below will read the CPU temp of a raspberry-pi device and send it to the collector.
./agent_linux_x86_64 -custom -name='cpu-temp' -unit='°C' -value=$(vcgencmd measure_temp | tr -d temp=\'C)
And in the collector alerts.json file can be configured with the following alert, which will send out Email/PagerDuty/Slack alerts when CPU temp goes more than warning (60°C) or critical (80°C) for trigger interval (120 seconds).
alertprocessor also can modify an alert in PD or Slack if the warning state between normal, warn, and critical is updated. And it will auto-resolve the alert if the alert is resolved.
{
    "Servers": ["home-raspi"],
    "Name": "CPU Temp alert",
    "IsCustom": true,
    "Description": "",
    "MetricName": "cpu-temp",
    "WarnThreshold": 60,
    "CriticalThreshold": 80,
    "Op": ">",
    "TriggerIntveral": 120,
    "Template": "{subject}\n{serverName} {metricName} {value} {op} {expected} at {timestamp}\n{desc}\n{timestamp}",
    "Email": false,
    "PagerDuty": true,
    "Slack": true,
    "SlackChannel": ""
}

Server ping alerts⌗
Another addition to alerting is server ping failure alerts. Ping alerts can be configured in ther alert.json file similar to below configuration.
{
    "Servers": ["test"],
    "Name": "Ping status",
    "Description": "",
    "MetricName": "ping",
    "TriggerIntveral": 60,
    "Template": "{subject}\n{serverName} fails to ping > {triggerInterval} seconds at {timestamp}\n{desc}",
    "Email": false,
    "PagerDuty": true,
    "Slack": true,
    "SlackChannel": ""
},